06 Dec Integration of in situ and satellite data for top-down mapping of Ambrosia infection level
PhD Isidora Simović
Research Associate, BioSense Institute
Ragweed is an invasive species that was transmitted to Europe in the 19th century from its natural habitat – North America, spreading at a high rate, primarily in the south-eastern part. As a high allergen, it became the scientific focus of many disciplines. In order to understand the importance of mapping the ragweed infection in crops, apart from the usual focus on medical costs, one should also take into account the large yield losses and costs of weed management.
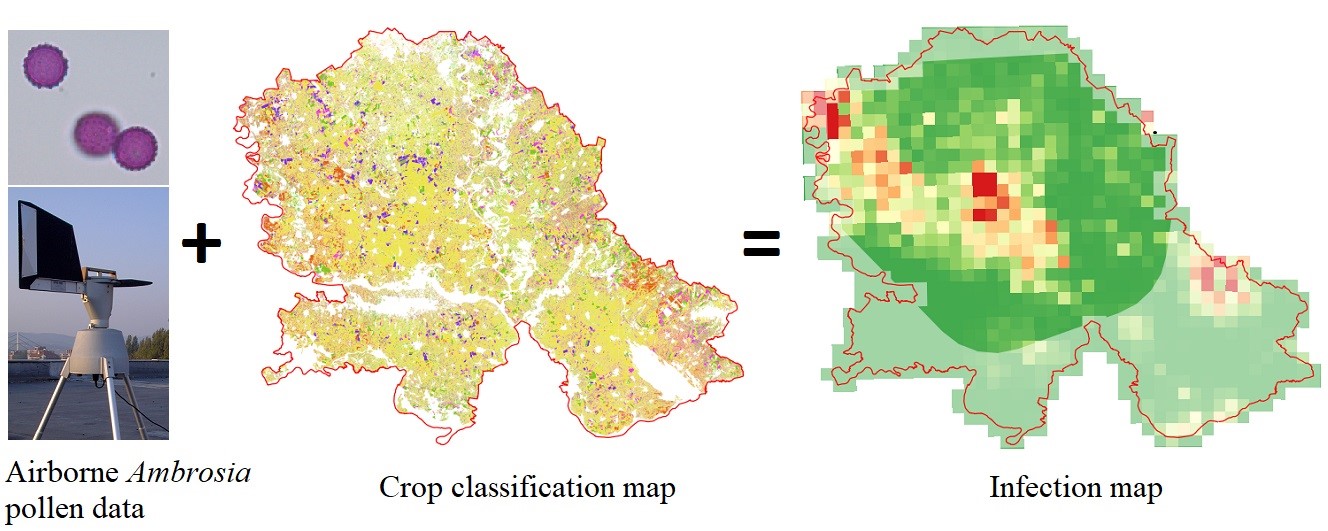
The BioSense team has developed an algorithm to detect the amount of ragweed in crops using satellite imagery, which has been a major challenge so far. The only previous study to successfully detect Ambrosia from satellite images was constrained to urban areas. Other methods are indirect and distinguish ragweed based on the water retention in its leaves during the period when the crops are harvested.
The study was conducted on an area of 21,500 km2 (Figure 1) comprising of 5 aerobiological stations monitored over 5-year period. The mapping of the ragweed distribution was done using an approach that combines distribution of suitable habitats and airborne pollen concentration.
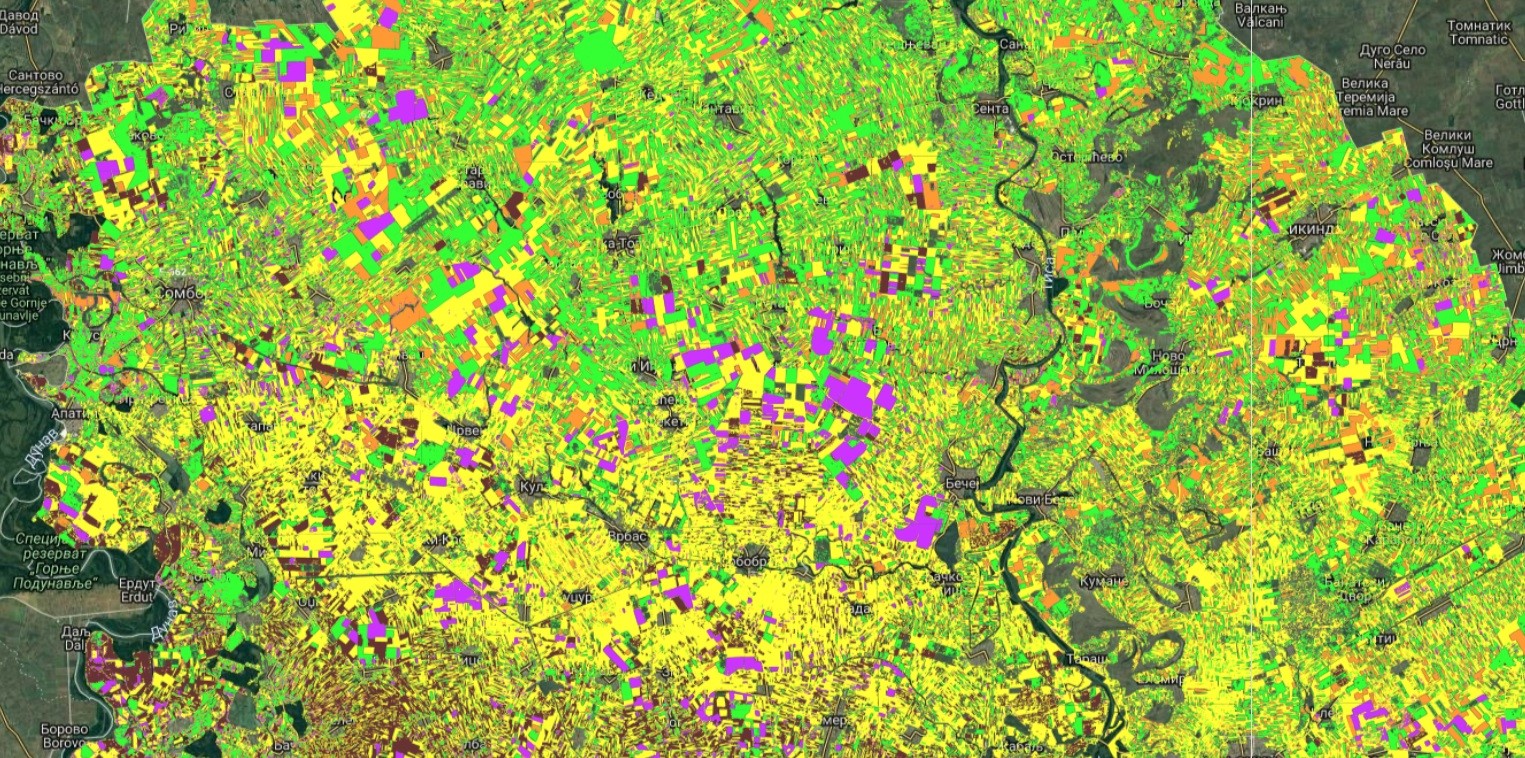
Figure 1. Crop classification in Vojvodina region
Starting from a circle of 30 kilometer diameter, as a rule of thumb in identifying pollen sources, several variations have been developed: taking into account direction and strength of the wind, using the SILAM model – previously developed with respect to air movements around aerobiological stations and areas weighted relative to the SILAM footprint for distances of 30km, 10km and 5km.
Reducing the diameter to 10 and 5km distance did not contribute to the information about the catchment area. The average seasonal SILAM model had an almost circular shape indicating that using a 30km diameter circle is a reasonable approximation of the ragweed pollen source.
Previous researches show that these pollen concentrations are influenced by the direction and the strength of the wind, so the shape of the catchment areas were modelled according to the mean monthly values of dominant winds. These mean wind values do not carry sufficient information to explain the source of pollen, so their correlation at a better temporal resolution (i.e. every hour) should be analysed.
Comparing different methods for calculating catchment areas, we found that there was no significant improvement in correlations nor the adjusted coefficients of determination when the air movements were taken into account. As the differences are not significant, it is concluded that the simpler methods are sufficiently precise for the inventory of pollen catchment areas.
A previously used satellite land use monitoring system – Corine Land Cover (CLC) monitors changes at a six-year rate. According to the CLC classification, the majority of Vojvodina is covered by non-irrigated arable land (73.07%) followed by complex cultivation patterns (3.17%). This classification of land does not record seasonal variability in land use, and therefore cannot be used to meaningfully interpret differences in airborne pollen concentrations between the measuring stations. Such datasets are more practical for long-term assessments.
The newly developed model monitors seasonal changes in land use using machine learning that recognizes agricultural crops with 86 to over 90% accuracy from satellite imagery. The results show that this method significantly improves the mapping system of ragweed pollen sources (Figure 2).
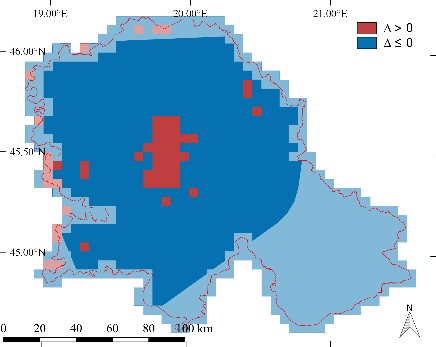
Figure 2. Differences (Δ) between Ambrosia top-down inventories produced by combination of non-agriculture CLC land use classes with distribution of fields under sugar beet and soya been, and by CLC land use classes only, in 2013
In addition to improving temporal and spatial resolution, it allows association of any given crop type with the amount of Ambrosia pollen. Thus, negative correlations with sunflower and cereals were observed, which could be related to the common harvest practices in this region and the use of proper weed control management. The highest ragweed infestation was found in soybean and sugar beet, so these surfaces are related to the most of the variability of ragweed pollen.
This study is a pioneer in a more accurate estimation of the distribution of plants susceptible to Ambrosia infestation, and it raises the question of how the newly developed method would fit the pollen inventory models used to forecast atmospheric pollen concentrations of Ambrosia.
Full paper publication is available at:
https://www.sciencedirect.com/science/article/pii/S0034425719304742?dgcid=author